- Регистрация
- 21.07.20
- Сообщения
- 40.408
- Реакции
- 1
- Репутация
- 0
On Oct. 7 Cointelegraph reported that top crypto traders had kept a bearish stance since mid-September and at the time the Bitcoin (BTC) long-to-short ratio had reached its lowest level in 10 weeks. All of this changed in a matter of hours as soon as BTC broke through the $11,000 resistance.
Whenever Bitcoin's volatility gets too low, it usually signals that traders became too complacent. Naturally, there will be periods of range trading, but short-term unpredictability is Bitcoin's defining characteristic.
For pro traders, implied volatility is commonly known as a fear index because it measures the average premium being paid in the options market. Any unexpected substantial price movement (both negative and positive) will cause the indicator to increase sharply.

Bitcoin 3-month implied volatility. Source: Skew
Take notice of how the 3-month options recently touched its lowest levels in seventeen months. This should not be interpreted as a riskless market, as the S&P 500 3-month volatility currently stands at 28%. That's not even half of Bitcoin's current 60%; therefore, a $500 daily candle should not come as a surprise.
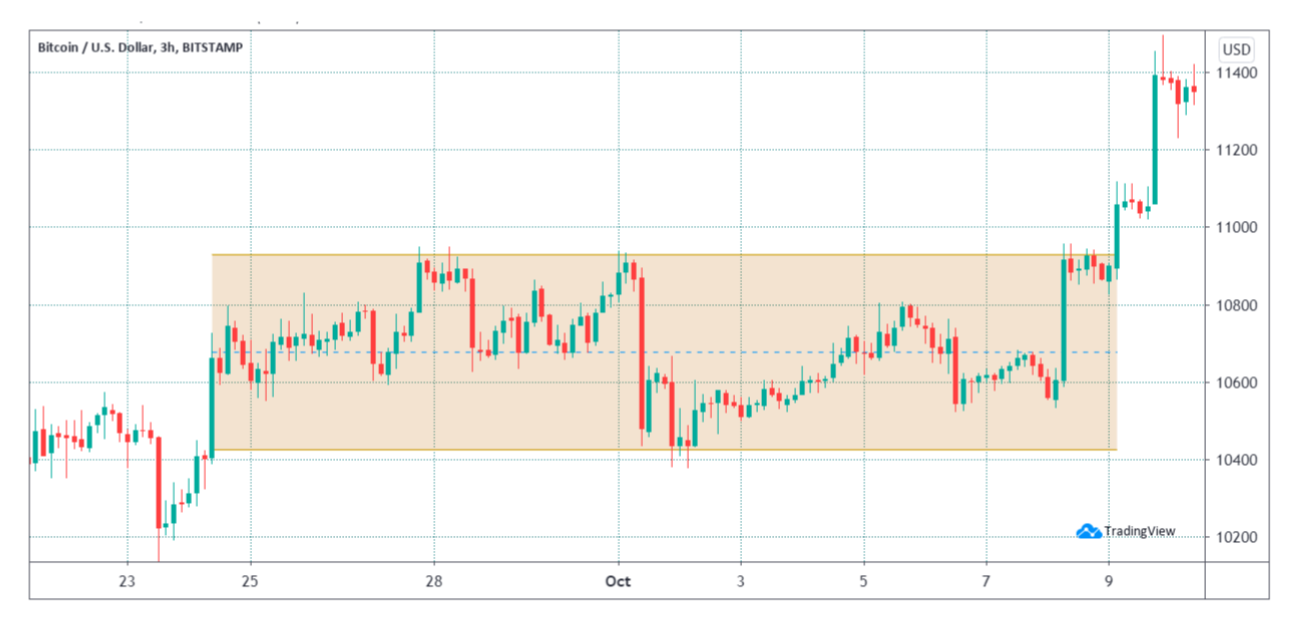
The most recent two-weeks saw Bitcoin price trade in the $10,400-$10,900 range and BTC futures open interest increased by $300 million. This shows that although it was a seemingly quiet period, traders had increased their bets.

BTC/USD 3-hour chart. Source: TradingView
Regardless of the reason behind the most recent price movement, top traders rushed to cover their short positions. Meanwhile, the futures contracts premium has remained modest, signaling room for a sustainable rally.
The futures premium signals that all is well
A futures contract seller will usually demand a price premium to regular spot exchanges. This situation happens in every derivatives market and is not exclusive to crypto markets. Besides the exchange liquidity risk, the seller is postponing settlement, therefore the price is higher.
Healthy markets tend to trade at a 5% to 15% annualized premium, known as basis rate. On the other hand, futures are trading below regular spot exchanges indicating short-term bearish sentiment.

Bitcoin 3-month futures annualized basis. Source: Skew
As the chart above indicates, the last time BTC futures held a 15% premium was on Aug. 18, and since then they have kept a slightly positive rate. Friday's rally was not enough to cause overleverage, thus reinforcing the short-covering thesis explained earlier.
To better gauge how traders are positioning themselves as BTC looks to establish $11,000 as a new support level, one should monitor exchanges' long-to-short ratios.
Top traders are 20% net long
Even though each futures market is balanced between buyers (longs) and sellers (shorts), top traders' positions can differ from a broader client base.
By exclusively aggregating top traders' net positions, one can determine how bullish or bearish their bets are.

OKEx top trader BTC long/short ratio. Source: OKEx
According to data from OKEx, the top traders' long-to-short ratio on the exchange bottomed at 0.75 on Oct. 9. This figure translates to a 25% net short position and can be interpreted as bearish.
During the following 24 hours, these traders not only closed their shorts, but also reverted to a 25% net long position. This is a good indicator of a reliable recovery, as opposed to a simple short-covering scenario.

Binance top traders BTC long/short ratio. Source: Binance
Binance data depicts a similar situation, as its top traders' long-to-short ratio spiked from 9% to 23% net long during the same period. It is worth noting that methodologies between exchanges will vary. Therefore one should monitor changes instead of absolute figures.
The above data indicate that top traders were, in fact, net short ahead of the recent BTC price surge. The futures premium has been held at a positive, healthy level, opening up room for further buy-side leverage.
Instead of betting on a typical "Bart Simpson pattern", top traders changed their stance and are now leaning bullish, supporting the thesis of a bull run to $14,000.
In the future, traders might consider shifting their positions according to data, instead of speculating on how price movements may or may not trigger trend changes.
It does not matter if the price swing holds relation to Square's recent 4,709 Bitcoin acquisition. If top traders are becoming bullish, then this is typically a signal that the trend is strengthening in that direction.
The views and opinions expressed here are solely those of the author and do not necessarily reflect the views of Cointelegraph. Every investment and trading move involves risk. You should conduct your own research when making a decision.
Whenever Bitcoin's volatility gets too low, it usually signals that traders became too complacent. Naturally, there will be periods of range trading, but short-term unpredictability is Bitcoin's defining characteristic.
For pro traders, implied volatility is commonly known as a fear index because it measures the average premium being paid in the options market. Any unexpected substantial price movement (both negative and positive) will cause the indicator to increase sharply.

Bitcoin 3-month implied volatility. Source: Skew
Take notice of how the 3-month options recently touched its lowest levels in seventeen months. This should not be interpreted as a riskless market, as the S&P 500 3-month volatility currently stands at 28%. That's not even half of Bitcoin's current 60%; therefore, a $500 daily candle should not come as a surprise.
The most recent two-weeks saw Bitcoin price trade in the $10,400-$10,900 range and BTC futures open interest increased by $300 million. This shows that although it was a seemingly quiet period, traders had increased their bets.

BTC/USD 3-hour chart. Source: TradingView
Regardless of the reason behind the most recent price movement, top traders rushed to cover their short positions. Meanwhile, the futures contracts premium has remained modest, signaling room for a sustainable rally.
The futures premium signals that all is well
A futures contract seller will usually demand a price premium to regular spot exchanges. This situation happens in every derivatives market and is not exclusive to crypto markets. Besides the exchange liquidity risk, the seller is postponing settlement, therefore the price is higher.
Healthy markets tend to trade at a 5% to 15% annualized premium, known as basis rate. On the other hand, futures are trading below regular spot exchanges indicating short-term bearish sentiment.

Bitcoin 3-month futures annualized basis. Source: Skew
As the chart above indicates, the last time BTC futures held a 15% premium was on Aug. 18, and since then they have kept a slightly positive rate. Friday's rally was not enough to cause overleverage, thus reinforcing the short-covering thesis explained earlier.
To better gauge how traders are positioning themselves as BTC looks to establish $11,000 as a new support level, one should monitor exchanges' long-to-short ratios.
Top traders are 20% net long
Even though each futures market is balanced between buyers (longs) and sellers (shorts), top traders' positions can differ from a broader client base.
By exclusively aggregating top traders' net positions, one can determine how bullish or bearish their bets are.

OKEx top trader BTC long/short ratio. Source: OKEx
According to data from OKEx, the top traders' long-to-short ratio on the exchange bottomed at 0.75 on Oct. 9. This figure translates to a 25% net short position and can be interpreted as bearish.
During the following 24 hours, these traders not only closed their shorts, but also reverted to a 25% net long position. This is a good indicator of a reliable recovery, as opposed to a simple short-covering scenario.

Binance top traders BTC long/short ratio. Source: Binance
Binance data depicts a similar situation, as its top traders' long-to-short ratio spiked from 9% to 23% net long during the same period. It is worth noting that methodologies between exchanges will vary. Therefore one should monitor changes instead of absolute figures.
The above data indicate that top traders were, in fact, net short ahead of the recent BTC price surge. The futures premium has been held at a positive, healthy level, opening up room for further buy-side leverage.
Instead of betting on a typical "Bart Simpson pattern", top traders changed their stance and are now leaning bullish, supporting the thesis of a bull run to $14,000.
In the future, traders might consider shifting their positions according to data, instead of speculating on how price movements may or may not trigger trend changes.
It does not matter if the price swing holds relation to Square's recent 4,709 Bitcoin acquisition. If top traders are becoming bullish, then this is typically a signal that the trend is strengthening in that direction.
The views and opinions expressed here are solely those of the author and do not necessarily reflect the views of Cointelegraph. Every investment and trading move involves risk. You should conduct your own research when making a decision.

